Sunday, July 28, 2013

Visualization of Hurricane Exposure in US


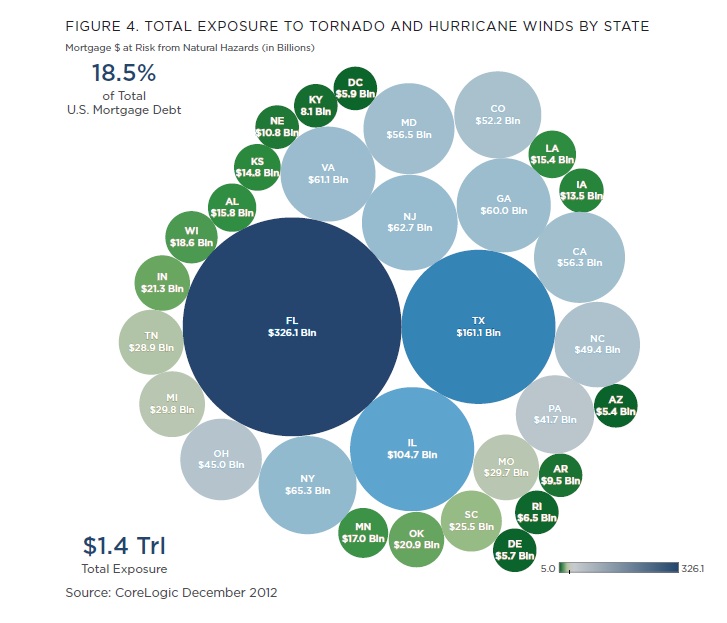
Barry Ritholtz pulled out this graph of Hurricane Exposure by state from Core Logic, June 2013. This picture shows that Florida, Texas, and Illinois have the highest exposure to this natural phenomena. The size and color of the circles represent the amount of the exposure.

Here is the link of the blog.

Saturday, July 27, 2013

Excel Apps: Infogram Tool for Creating Charts on Excel


Now we can add to our Excel 2013 beautiful graphs that allow us to communicate better with data. It is an app created by Infogram that does the magic. Here is an example that we can do.

Here is the link to install the app.

Visualize your Email Network


Immersion is another way to visualize your email contacts. The program accesses to your Gmail account, and gives you a visual snapshot of your most frequent contacts. 

I hope Gmail and Outlook can add this new cool tool to have a visual look of our email contacts.

Here is the link: https://immersion.media.mit.edu/
Here is the demo link: https://immersion.media.mit.edu/demo


Visualizing Financial Results: PepsiCo Infographic Quarterly Performance


PepsiCo has begun to publish a quarterly infographic report to investors and analysts. It is a very unusual but effective way to highlight officially its main results to stakeholders. Here is the infographic link: www.pepsicoinfographicq2.com


Thursday, July 25, 2013

Data Visualization: Finding the Perfect Assist by KickDex


Nice way to show where the assists originate using data visualization. In his article, KickDex used the Premier League data of the last three seasons to graph where assists started and ended. Here are the results:  

Assists originate:


Assists end:


Here is the link of the article: The 'Perfect' Assist

Tuesday, July 23, 2013

The Beauty of Data Visualization by David McCandless


Nice video on data visualization made by David McCandless in TED. The key ingredients to data visualization are patience and imagination to make outstanding results.


The World's Biggest Data Breaches


Nice way to present important information of data breaches by the friends of informationisbeautiful.net. They collected all these data since 2004, and organized them in an interactive graph. This graph includes time (axis), number of records stolen (size), and degree of interest (color).


Here is the link.